Math Sandbox
Calculated
Precision.
Design bespoke engineering dashboards instantly. Map raw channels to derived outputs, and render high-fidelity telemetry graph's with Matplotlib
Sandbox TUI Editor

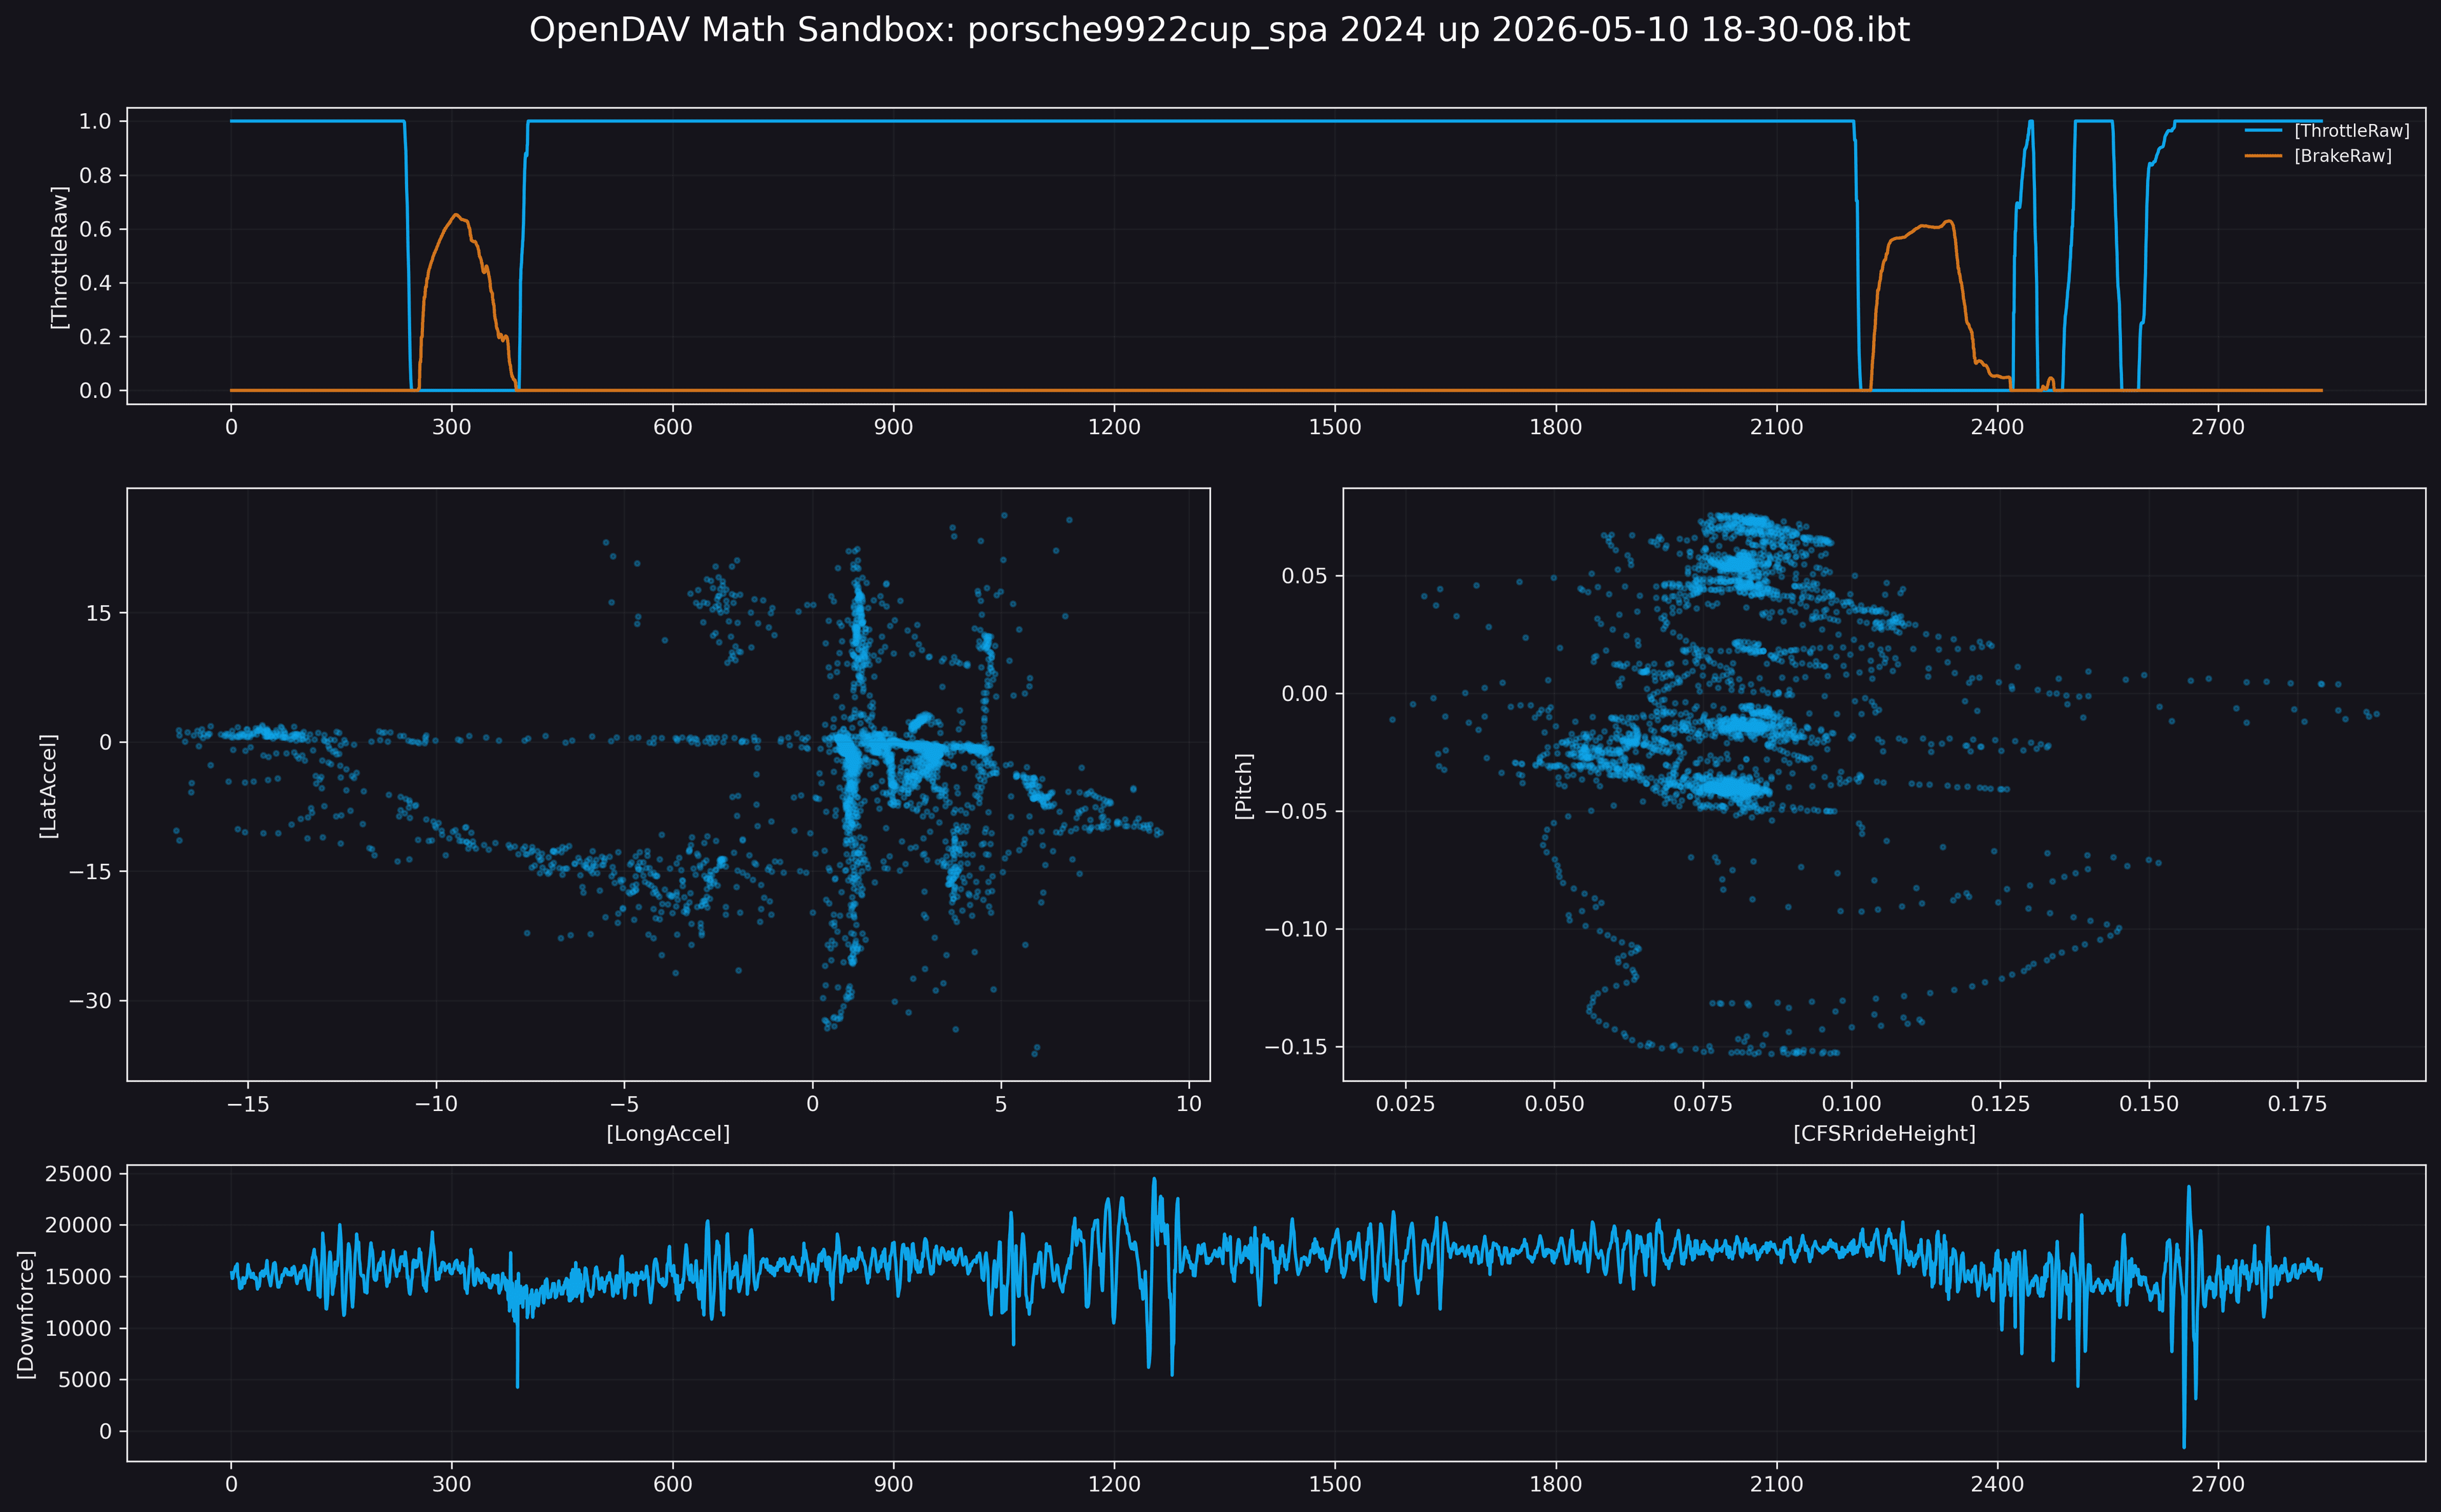
Dashboard Render
Custom Syntax Parsing
Use `L [Channel]` for line graphs, or `SP [LatAccel], [LongAccel]` for immediate traction circles. The NumPy evaluation engine handles all structural array mathematics instantly.
Multi-Layer Stacking
Overlay multiple expressions into a single pane. The sandbox automatically bounds the Y-axis, dynamically colors each layer, and generates clean legends without you writing any plotting code.
Visualization Models (VM)
Save your complex 4-pane layouts directly to disk as JSON presets. Recall them instantly with `Ctrl+S` and `Enter` to standardise visualizations across the engineering team.